

Report usage analytics: What Power BI tracks, and what it misses
Somebody asks you to justify the reporting estate. You can list what has been published. You can probably say who has access. The question you cannot answer quickly is which of those reports anyone actually opened last month, and which have been sitting there for a year with an audience of nobody.
This is not negligence. It is a gap in what the native tooling shows, and it is worth understanding precisely before deciding whether it needs fixing.
What Power BI already tells you
More than most people realise, and less than they need. There are three separate mechanisms, and they are frequently confused with one another.
| Mechanism | Scope | History | What it takes to reach |
|---|---|---|---|
| Usage metrics report | One report or dashboard at a time | 90 days | Fabric1 or PPU2 licence, plus edit access to that item |
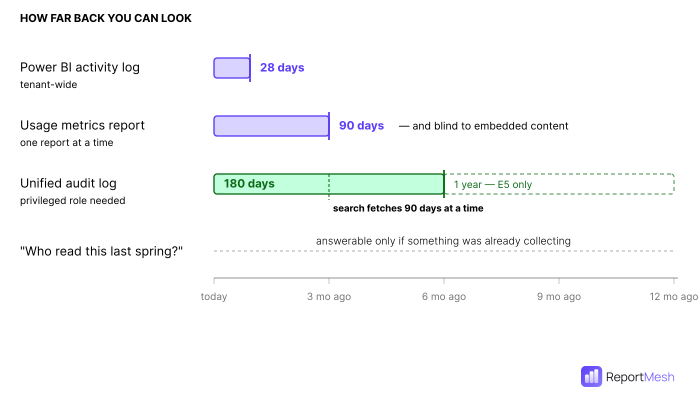
| Activity log | Tenant3-wide Power BI events | 28 days | Fabric administrator |
| Unified audit log | Power BI, SharePoint, Teams, Exchange together | 180 days (1 year on E54) | A high-privilege role Power BI admins do not hold by default |
As of August 2026.
The usage metrics report is the one people mean when they say Power BI tracks this. The catch is in that first column: it is per item. There is no built-in tenant-wide view, so answering "across everything we publish, what gets used" means opening it for every report in turn, or building your own report against each workspace's usage metrics semantic model5. Microsoft documents that as something you can build, not something that exists.
The activity log is tenant-wide, and 28 days is the figure that catches people out. After that the events are simply gone unless somebody was already exporting them (a question asked in April about behaviour in January has no answer.
The unified audit log is routinely misdescribed, so: Power BI events are in it by default,
alongside SharePoint, Teams and Exchange. Anyone who tells you the records cannot be combined is
wrong. The obstacles are retention and reach. Entitlement is per user, so non-E5 users and all
guests fall back to 180 days regardless of what the tenant bought;
Search-UnifiedAuditLog6 retrieves 90 days at a time; and reaching any of it needs a
privileged role Power BI administrators do not have by default.
The gap nobody mentions
Here is the part that matters most if you distribute reports through a portal, and it is stated plainly in Microsoft's own documentation:
Usage metrics don't track dashboards and reports embedded via the "user owns credentials"7 or "app owns credentials" flow.
Those two phrases are Microsoft's names for the two ways an application can embed a report. Publish-to-web8 content is not tracked either.
Embedding is the standard way to get reports in front of people who do not have Power BI licences. So for that audience, the native usage metrics report tells you nothing. Not less. Nothing. The activity log still records some service-level events, but the tool everyone reaches for first has a blind spot shaped exactly like the delivery model most external reporting uses.
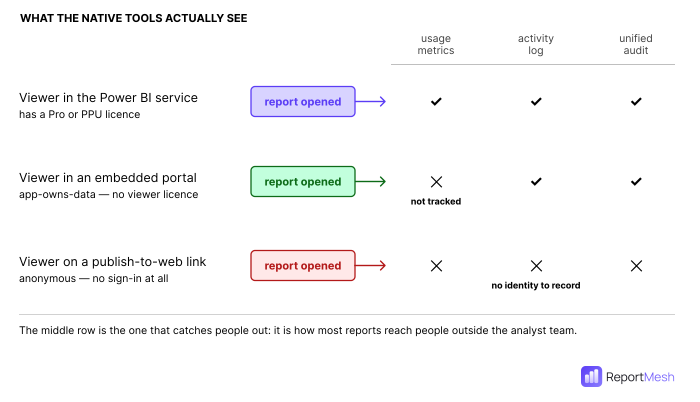
So the honest version of the premise is narrow: most organisations cannot answer the question centrally, quickly, or retrospectively, and if they distribute through embedding, they largely cannot answer it at all with native tooling. There is no survey behind the broader "organisations have no idea", and you should be suspicious of anyone who quotes one.
Which brings up a figure you will meet if you search this topic. "90% of dashboards go unused within six months" circulates widely and has no traceable source; every citation leads to another blog. We are not going to repeat it. The closest thing to real evidence is consultancy EPC Group's9 observation from audited Power BI environments: 35–50% of reports seeing fewer than five views a month, 15–25% seeing none at all in 90 days, and 15–25% being functional duplicates. One firm's observation, no published methodology, but directionally consistent with what most people find when they finally look.
What is worth collecting
Four things, and the fourth is the one that gets forgotten.
Who opened it. Not just a count. A count tells you a report is alive; an identity tells you whether the audience is the one you built it for. A finance report with healthy numbers driven entirely by three people in finance is working. The same numbers driven entirely by its own author refreshing it is not.
When. Timestamps turn usage into shape. Month-end spikes, quarterly reporting cycles and the Monday-morning pattern all say something a monthly total flattens away.
For how long. Opened and closed in four seconds is a different event from opened and read for six minutes, and only one of them is evidence anybody used the thing. This is also where honesty about the measurement matters: a browser tab left open all afternoon is not six hours of reading.
A record that outlives the native window. This is the one that only becomes obvious when somebody asks a question about last year. If your retention is 28 or 90 days, every question about a period longer ago than that is unanswerable, permanently, and no amount of urgency will recover it. The decision to keep the record has to be made before you need it.
The case against measuring this at all
The strongest objection to everything above is that view counts are a poor proxy for value.
A report opened twice a year can be the most important one in the building. The board pack. The annual regulatory filing. The incident runbook that is only opened when something has gone badly wrong. Rank the estate by view count and every one of these sorts below a dashboard somebody left running on an office screen that nobody reads. If you retire by view count alone, you will eventually delete the disaster-recovery report the week before the disaster.
That EPC Group figure cuts both ways for the same reason. Some of the 15–25% seeing no views in 90 days is dead weight; some of it is the thing you will be very glad still exists. The number cannot tell you which; usage data tells you where to ask the question, not what the answer is.
Low usage often means friction, not irrelevance. A report nobody opens may be one nobody can find, or one that takes 40 seconds to load. Both look identical in the numbers, and neither is solved by deletion.
And measuring changes behaviour. Once owners know view counts are reported upward, some will optimise for them (splitting one report into several, pinning things to force impressions). We have not seen this quantified, so treat it as a reasoned risk rather than a measured one; it is the standard failure mode of any metric that becomes a target.
The defensible position is the modest one: usage data is a prompt for a conversation with a report's owner, not a verdict. It is good at generating the shortlist and bad at making the decision.
The compliance case, stated accurately
This is an area where vendors habitually overclaim, so here is the careful version.
HIPAA is the direct one. The Security Rule's audit-controls standard, 45 CFR §164.312(b), requires mechanisms that "record and examine activity in information systems that contain or use electronic protected health information". It is a required standard, not an addressable one, with no risk-assessment escape hatch. It does not name report views as the unit of record, but where reports carry PHI10, a view log is a natural way to satisfy it.
SOC 2 is the one an auditor will actually ask about. Logging and monitoring sit under Common Criteria11 CC6.1, CC7.2 and CC7.3. Practitioner guidance converges on logs that tie actions to identified users, cover access events, and are retained (commonly 12 months, with 90 days readily searchable. That is practitioner consensus rather than a number the AICPA12 publishes, and it should be described that way.
GDPR does not require this, and we are not going to say it does. Article 30 requires a record of processing activities (categories, purposes, recipients), which is a different artefact from a view log. Article 32 requires appropriate technical measures, and audit logging is a reasonable way to demonstrate them. Both support the accountability principle. Neither says "log who opened which report", and anyone telling you GDPR mandates report view logs is selling something.
The practical upshot is narrower than the marketing version and more useful: if your reports carry health data, logging access is required. If you are going through SOC 2, you will be asked to evidence access logging and retention. Everywhere else it is good practice that becomes valuable the first time somebody asks who saw a figure before it was restated.
Where ReportMesh fits
ReportMesh records a view every time a report is opened: who opened it, which report, when, and how long it stayed open. Reports and Excel workbooks are covered the same way. Alongside the usual summary, per-report and per-user views, there is a stale-reports view that answers this post's opening question directly: content below a view threshold you set, with never-opened items listed first.
It is in the base product. That is a deliberate choice and worth checking against whatever else you are evaluating; in this category usage analytics is commonly a top-tier feature or a paid add-on, which tends to mean the organisations least able to justify the upgrade are the ones who never find out what their reporting estate is doing.
Three details worth stating because they are the ones that decide whether the record is any good:
No retention window is applied. Usage events are not aged out or purged, so how far back you can look is a function of how long the portal has been running, not a cap we impose. That matters against the 28-day and 90-day native windows, but the same caveat applies as to any log: a period before you started collecting is not recoverable.
The history survives deletion. Usage records deliberately hold no database link back13 to the report or the user, so deleting either does not take its history with it. A report that is removed does not quietly erase the evidence that fourteen people read it last quarter.
External viewers are recorded like everyone else. Views are stamped with which sign-in path the viewer used, and an administrator sees staff and external usage combined. This is the case where native tooling is weakest: guests fall to the shorter audit retention regardless of licence tier, and embedded delivery is invisible to usage metrics entirely.
What it does not do: permissions and analytics in ReportMesh work at the level of whole reports. The record tells you who opened a report, not which rows they saw inside it.
Worth reading alongside this: our post on one place to find every report, which covers the catalogue side of the same problem.
If you want to see the stale-reports view against your own content, book a demo.
Microsoft product limits as of August 2026. Retention windows, licence requirements and vendor tier contents change; check current figures before making a decision that depends on them.
Footnotes
-
Microsoft Fabric: Microsoft's analytics platform, which Power BI is now part of. Buying "Fabric capacity" means renting a fixed block of processing power for a monthly fee, rather than paying per person. ↩
-
PPU (Premium Per User): a Power BI licence tier above the standard Pro one, sold per person and giving access to features Pro does not include. ↩
-
Tenant: your organisation's own walled-off area within Microsoft's cloud. Everything your company owns in Microsoft 365 lives inside your tenant; another company's data lives in theirs. ↩
-
E5: the most expensive standard Microsoft 365 licence tier. Several security and compliance features, including longer audit-log retention, are only available on it. ↩
-
Semantic model: the prepared dataset sitting behind a report: the tables, the relationships between them, and the calculations. Several reports typically share one. ↩
-
Search-UnifiedAuditLog: a PowerShell command administrators run to query the audit log. PowerShell is Microsoft's scripting tool, so this is a typed command rather than something you click. ↩
-
"User owns credentials" and "app owns credentials": the two ways an application can show someone a Power BI report. Under the first, each viewer signs in to Power BI themselves and needs their own licence. Under the second (also called app-owns-data), the application holds one set of credentials on everyone's behalf, so viewers need no Power BI licence and never sign in to Power BI at all. The second is how report portals work, and it is the one native usage metrics cannot see. ↩
-
Publish to web: a Power BI feature that puts a report on a public web address with no sign-in. Anyone with the link can open it, and search engines can index it. ↩
-
EPC Group: a US consultancy that implements Microsoft technology (SharePoint, Power BI, Microsoft 365) for client organisations and publishes findings from that work. The figures quoted here come from their own write-up of Power BI report sprawl. They are one firm's observations from client environments, published without a sample size or a stated method, which is why they appear here attributed to EPC Group rather than as research, and why the post does not lean on them being precise. ↩
-
PHI (protected health information): health data about an identifiable person, as defined by US health-privacy law. In electronic form it is ePHI. ↩
-
Common Criteria: the shared set of requirements every SOC 2 audit is measured against. CC6.1, CC7.2 and CC7.3 are individual numbered requirements within it, covering access control and system monitoring. ↩
-
AICPA: the American Institute of Certified Public Accountants, the body that defines what a SOC 2 audit examines. ↩
-
No database link back: databases usually tie a record to its parent, so removing the parent can remove the record too. Usage events here deliberately store the report and user as plain values instead, so deleting a report or a person leaves the history standing. ↩